Welcome to the Potato Olympics!
Potato Olympic Games
Let The Games Begin!
Today your potato will compete in three events. You will need to record your potato's results and submit them using the form below.
To begin with, you will need to decide if you are using your own potato, or the interactive potato below.
Task 1: Using the interactive potato, record your results for the three games:
- Red Rascal Roll
- Potato Long Jump
- Spud Shot
Using the interactive:
Task 2: Once you have collected all your data from the potato olympics, enter the results below.
Graphing our Olympic Data
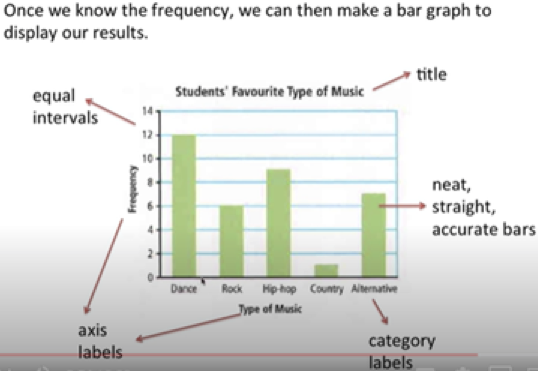
Bar Graph: A bar graph (or column graph) shows information in a graphical form by the use of columns or bars. It is used to compare data.
Bar Graph: A bar graph (or column graph) shows information in a graphical form by the use of columns or bars. It is used to compare data.
Task:
Below you can find the data from the Potato Olympic Events. Create a bar graph to show what you know about the potato competitors. Make three statements about your data from your graphs.
I.e. Your graph could be “Weight of all competitors”. A statement could be the highest number of spuds were in the weight range 250g to 280g.
The data you enter in the previous tab will appear in the table below once approved by a teacher. If you are having trouble reading the table below, you can download the data as a CSV file.
Graphing our Olympic Data
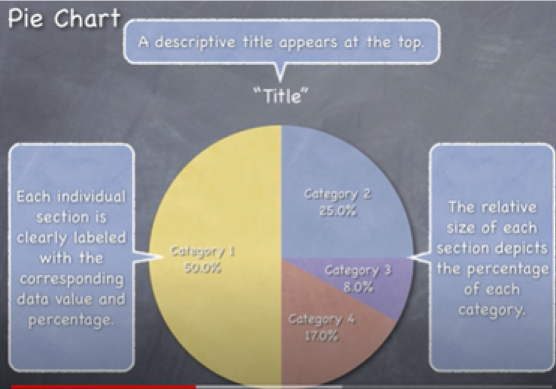
Pie Chart A pie chart is a circle graph divided into sectors that represents data as parts of a whole. The circle represents the total amount while the segments are the parts. When we compare the parts to the whole, we’re looking at proportion. This is often written as a fraction (or percentage).
Pie Chart A pie chart is a circle graph divided into sectors that represents data as parts of a whole. The circle represents the total amount while the segments are the parts. When we compare the parts to the whole, we’re looking at proportion. This is often written as a fraction (or percentage).
Task:
Using the same data from yesterday. Now create a pie graph to show something different about what you know about our competitors. Make three new statements about your data from your graph.
I.e. Your graph could be about the events, personal spud information.
Some questions might arise about the fairness of the games. How might you prove they are fair or not. How could you make them fairer? Some thoughts to ponder!!